Mapping Onchain Topology: Seeing Concentration Risk Before It Surfaces
How to manage concentration risk in onchain portfolios by mapping the topology of the system.

Onchain assets are often evaluated through surface-level metrics: price action, APY, TVL, token composition, or protocol label. These measures are useful, but on their own they miss a dimension of risk that matters increasingly as onchain markets grow more composable: topology.
An asset is not only a single holding. It is also a node in a graph of causal dependencies. Value and risk propagate through issuers, liquidity venues, oracles, bridges, and other shared infrastructure, so two positions that appear diversified at the label level can still depend on the same underlying rails.
From Lists to Graphs
Most DeFi analytics start with lists: assets, markets, yields, allocations. Lists are easy to read, but reading is exactly what flattens the structure underneath them.
A topology view restores that structure. The system is represented as a directed graph, where nodes are entities such as tokens, markets, and assets, and edges represent causal dependency. In the case of the Morpho protocol, this produces a natural directed acyclic graph.
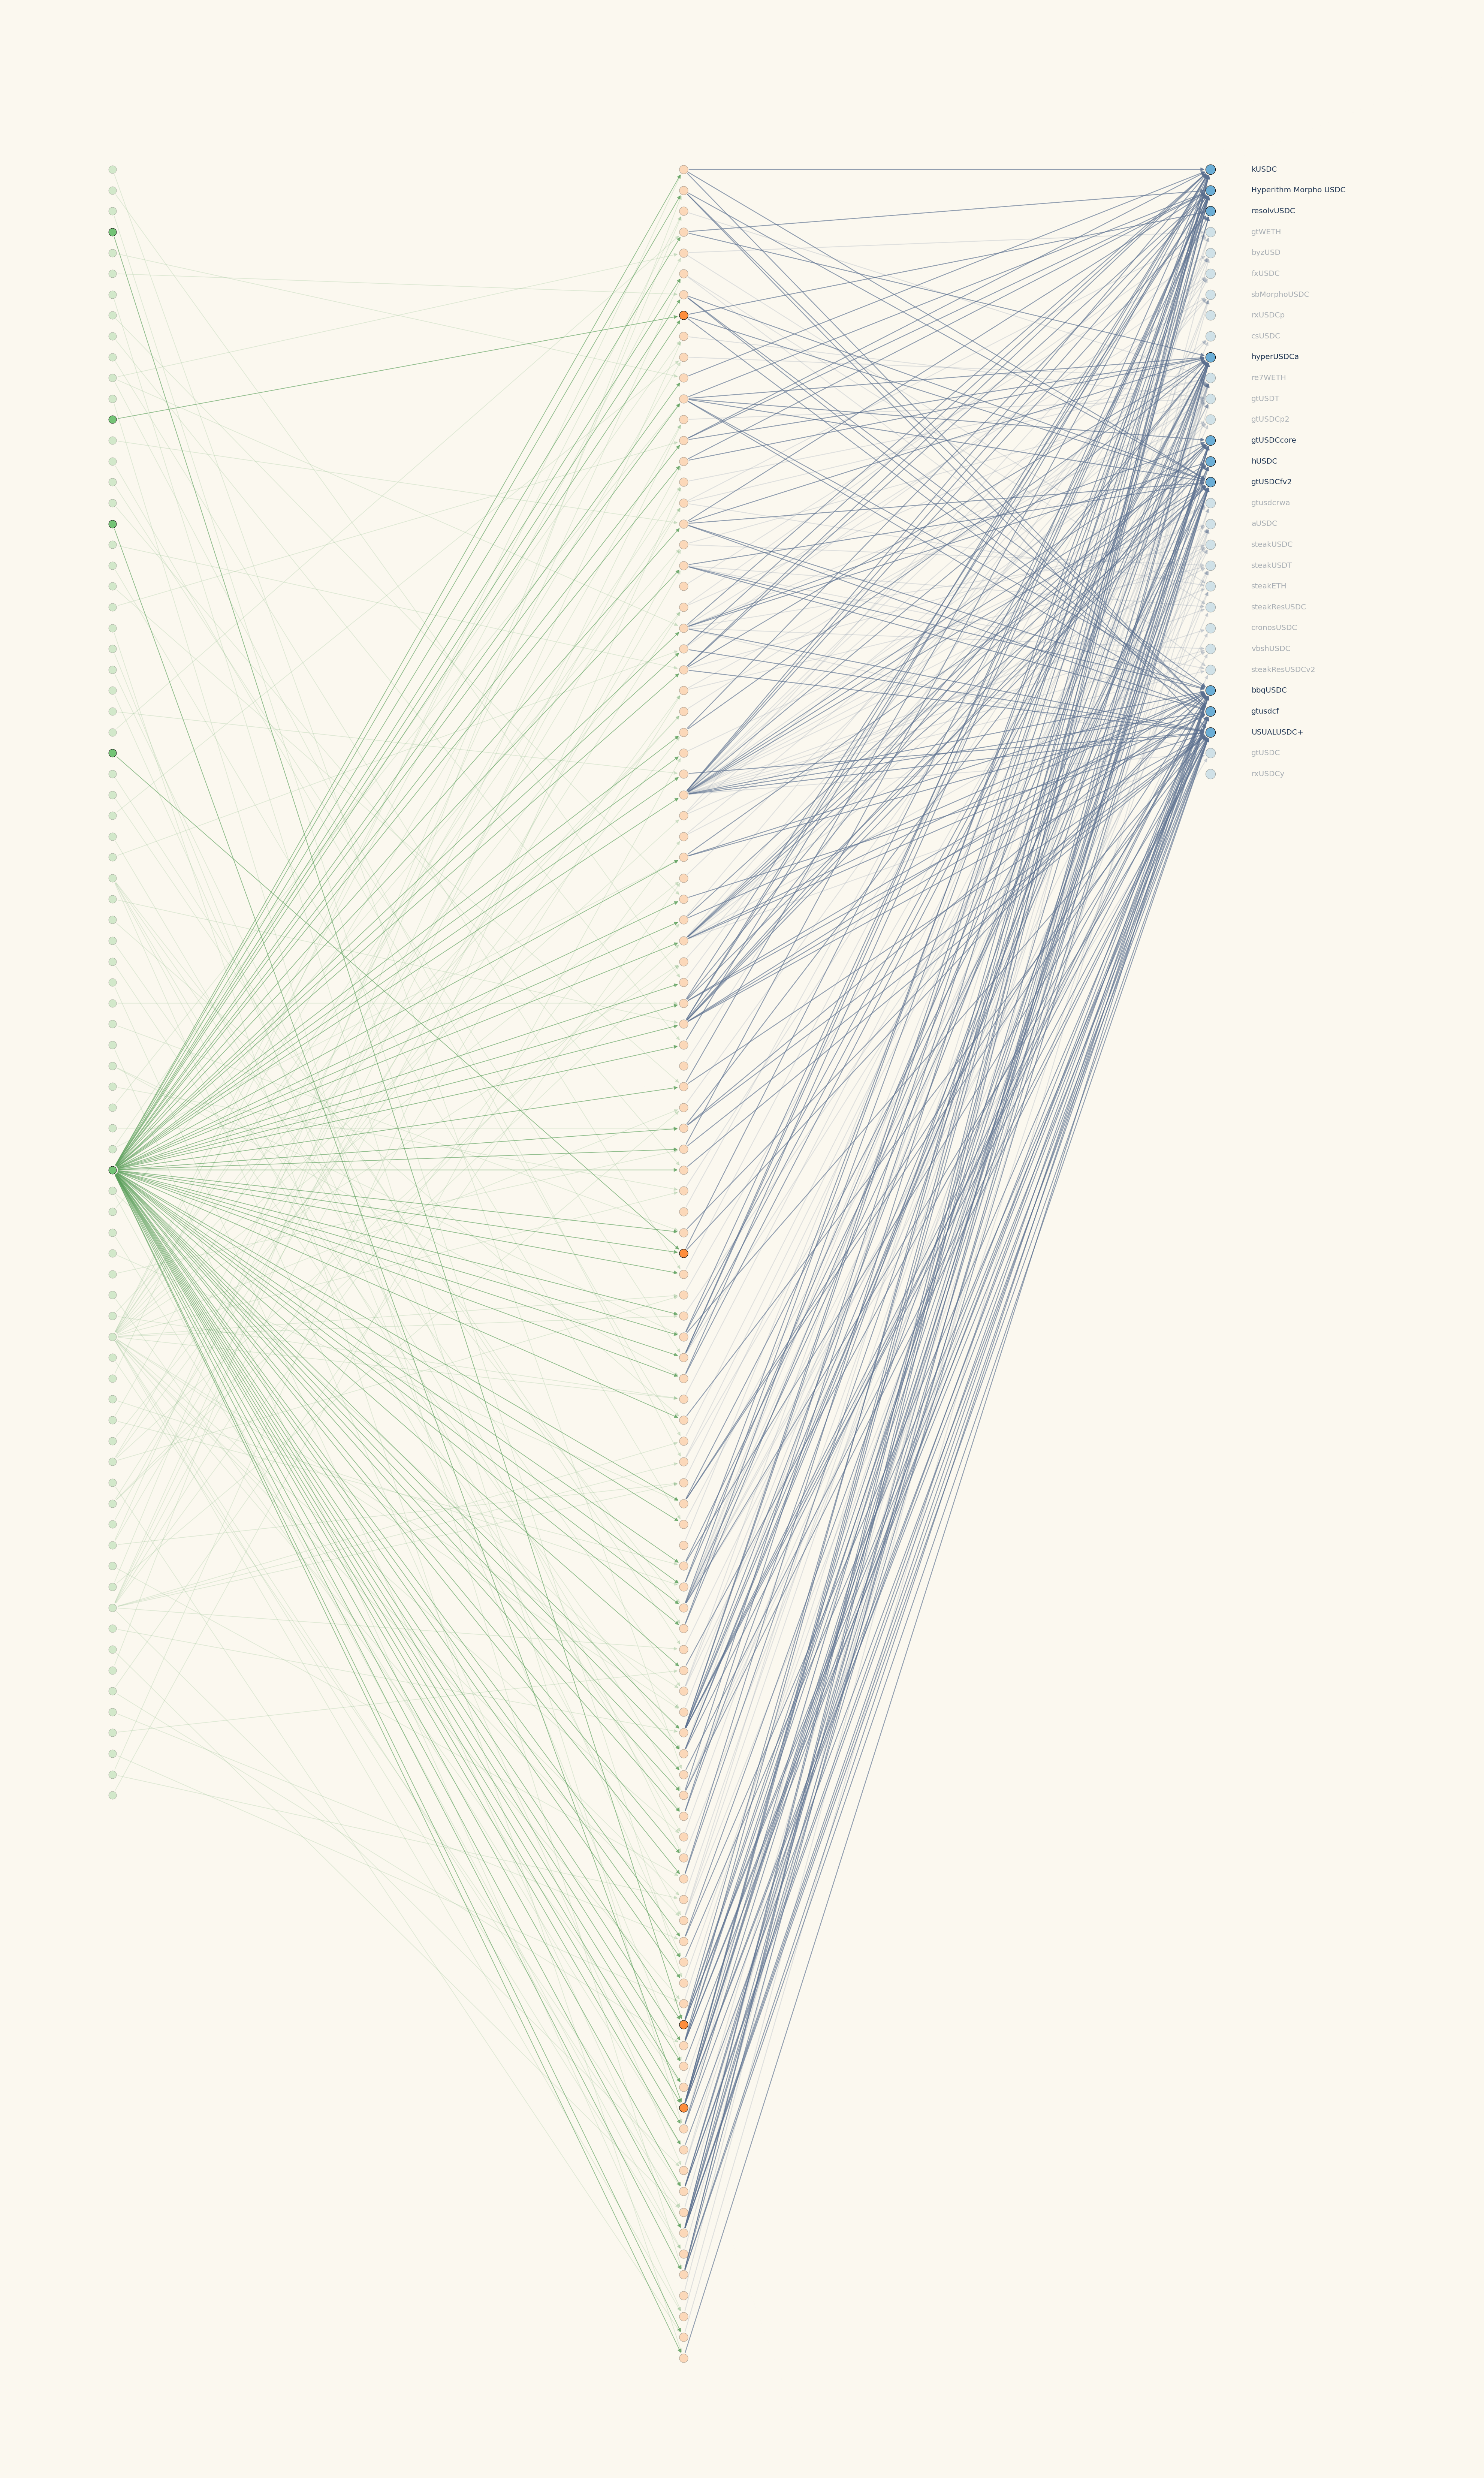
This representation makes it possible to analyze, programmatically, which assets connect to which markets, which markets share the same underlying tokens, and where large dependency hubs form.
The idea of representing financial systems as graphs has a long history in risk management. In a 1998 paper on hierarchical structure in financial markets, Mantegna showed that the topology induced by a correlation matrix can reveal an economically meaningful taxonomy of assets. The relevant insight is not specific to equities: assets that appear distinct can still be manifestations of the same underlying forces.
The failure of diversification is often a failure to recognize that assets are not independent objects, but manifestations of shared economic forces.
For onchain markets, the same principle applies with more force, because composability creates explicit dependency paths rather than merely statistical ones. That gives an asset manager a more granular view of where a given category of risk actually sits.
The Adjacency Matrix
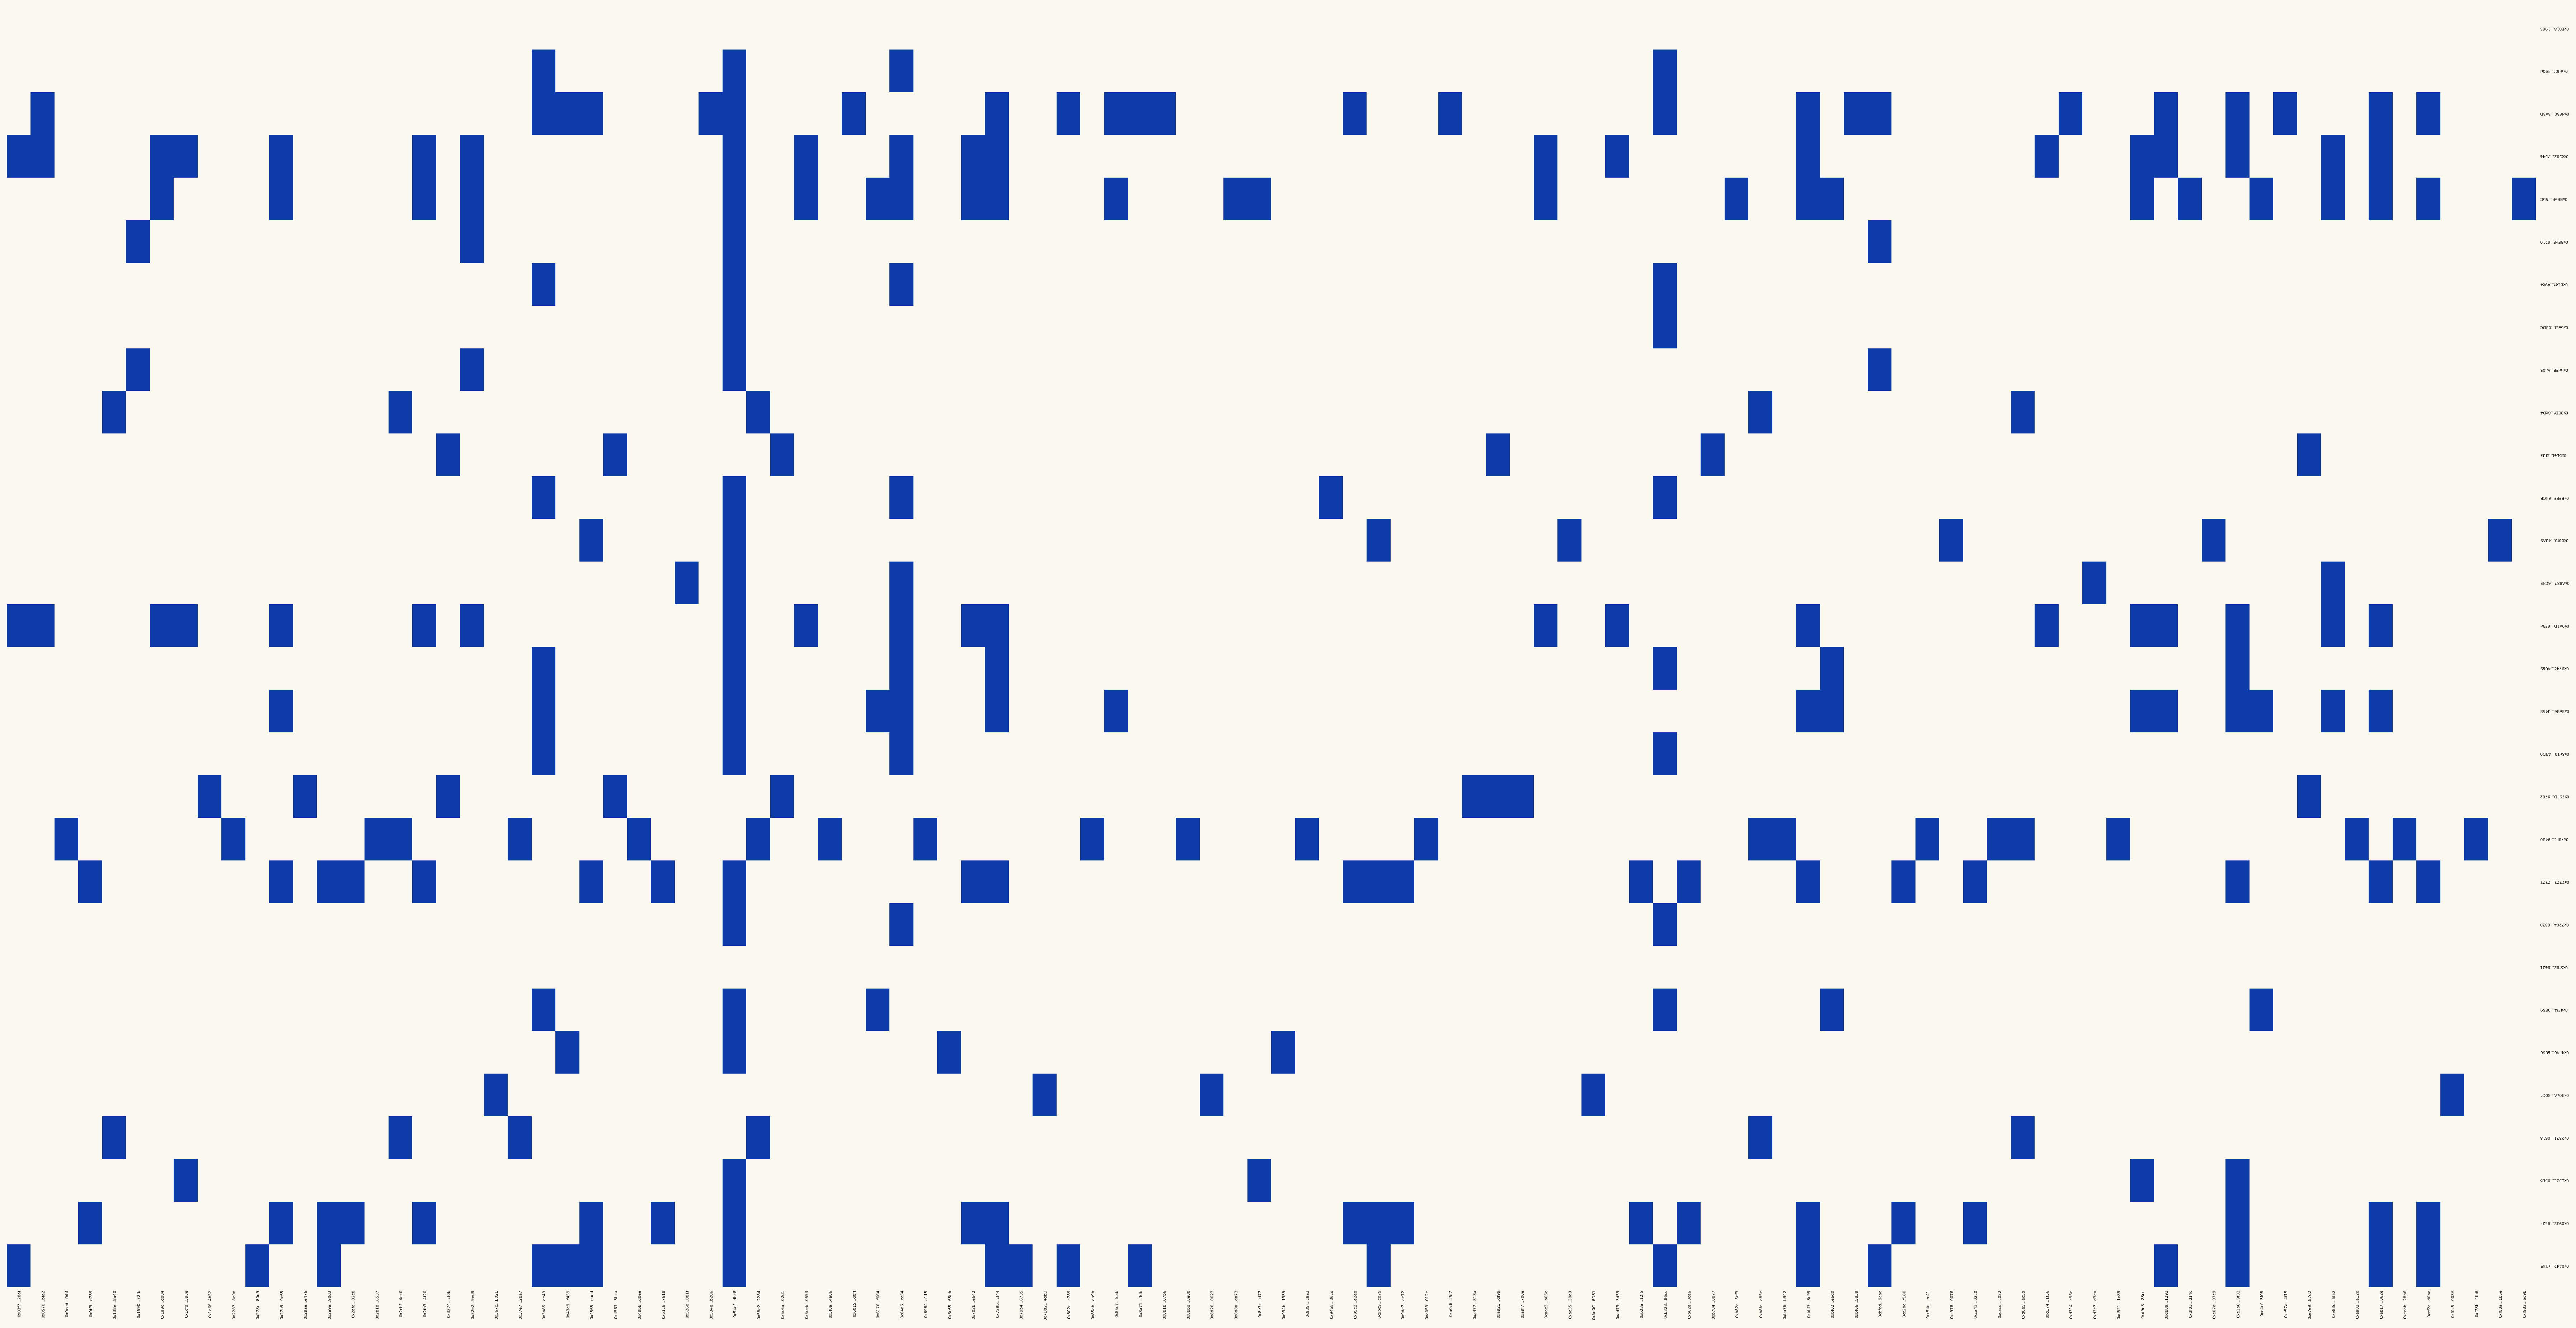
A graph is useful visually, but the same information can also be represented as an adjacency matrix.
An adjacency matrix is a simple object: rows and columns are nodes, and each cell indicates whether a dependency exists between two nodes. If a market routes into an asset, the corresponding cell is active. If two markets are used by the same asset set, that relationship can also be measured directly.
That gives a machine-readable foundation for risk analysis. Once the system is represented as a matrix, overlap, dependency concentration, shared markets, and clustering can be computed.
Concentration Risk Is Not Always Visible
The central risk here is hidden concentration.
An allocator may believe their portfolio is diversified because capital is spread across many assets. But if those assets route through the same small set of markets, depend on the same collateral type, or share the same liquidity venue, the effective exposure is more concentrated than the asset count suggests.
The closest analogy in equity markets comes from multi-factor models: a portfolio can hold dozens of stocks and still carry concentrated industry exposure. Names differ, but if most positions load on the same sector factor, the risk is driven by one macro bet, not by independent stock selection. Onchain topology plays a similar role: many asset names can mask a small number of shared dependency factors underneath them.
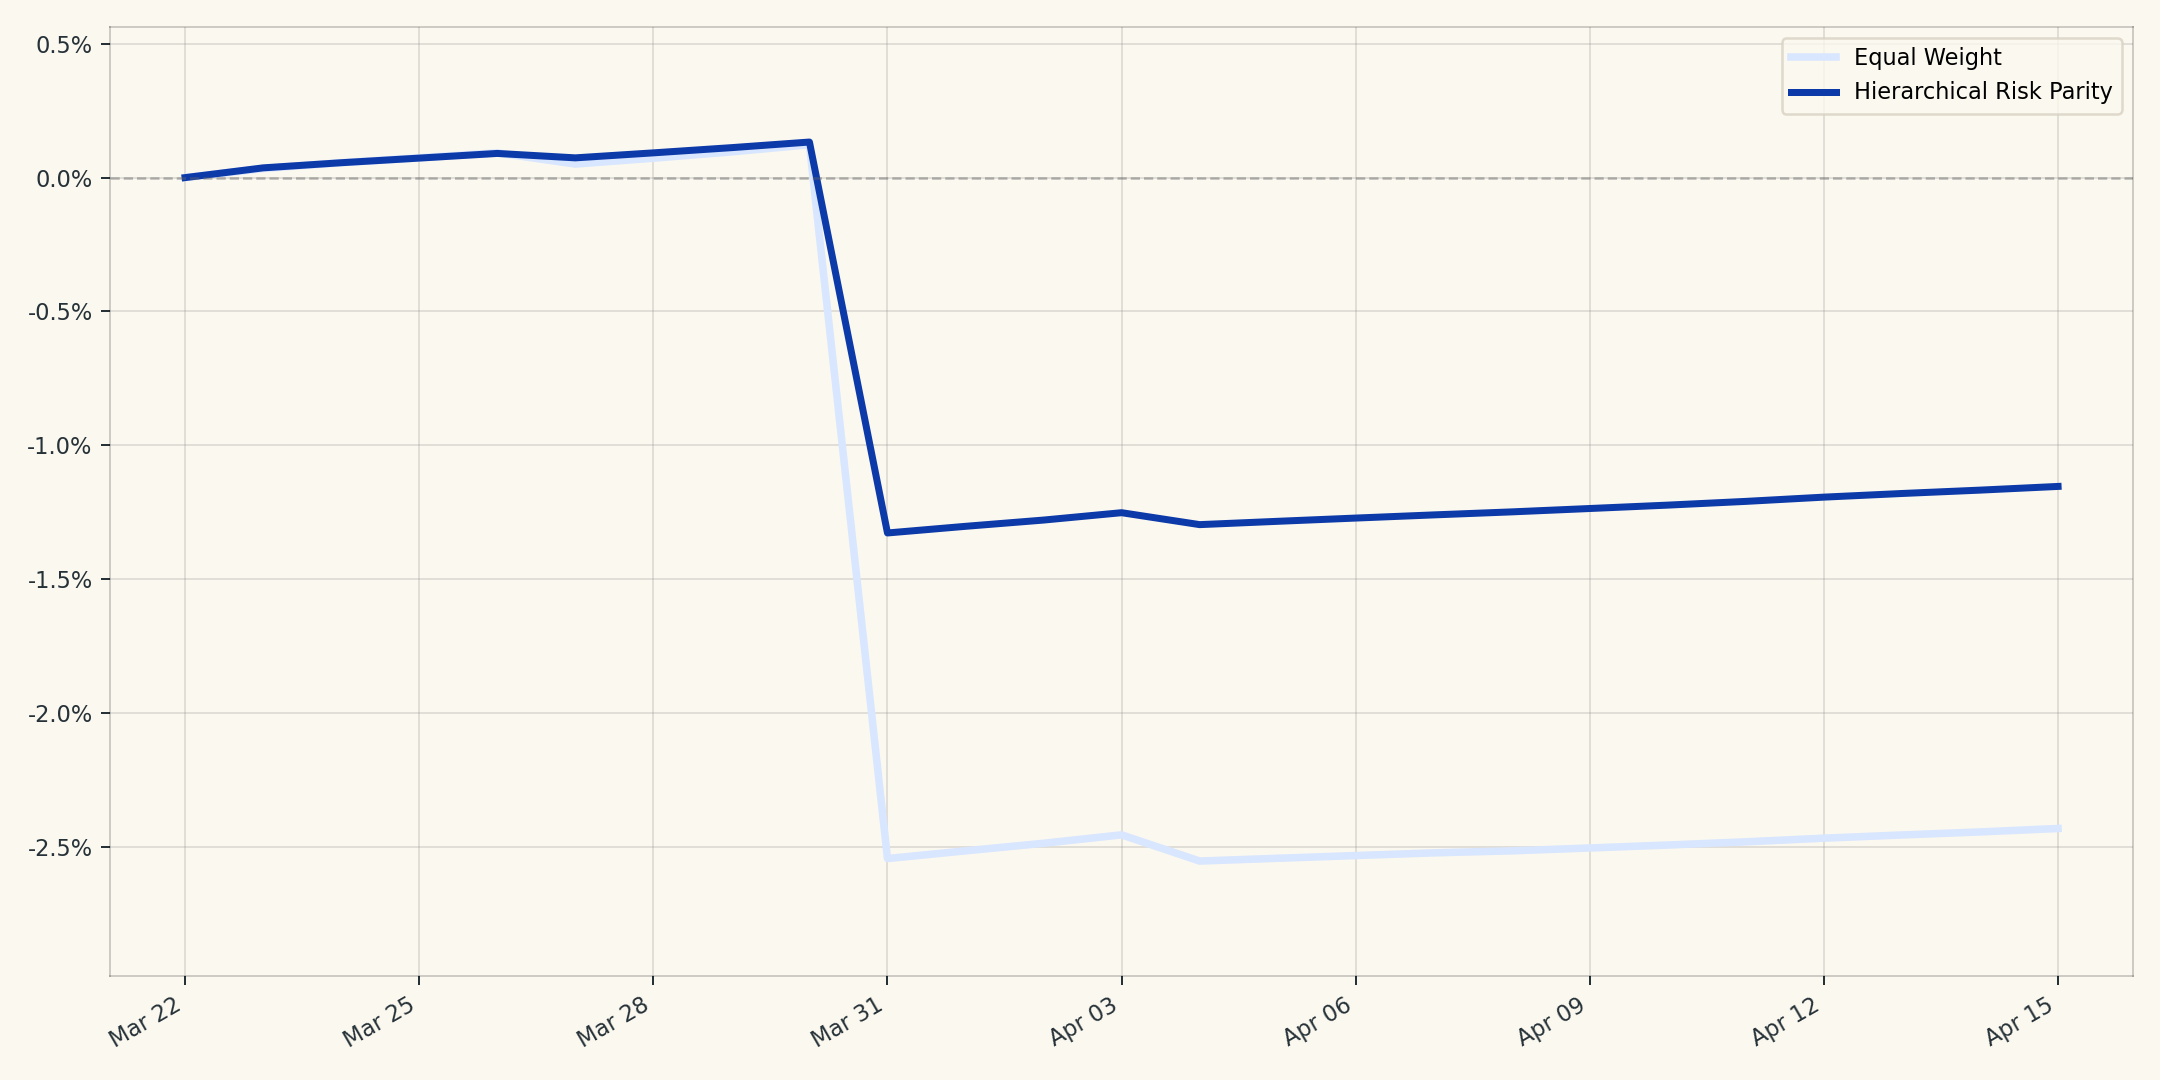
This is the core limitation of naive equal-weight allocation. It creates an illusion of diversification — many names, fewer true sources of risk — that only becomes obvious once one of those shared dependencies is stressed.
From Stress Tests to Topology-Aware Allocation
A simple example makes the point concrete. Suppose eleven onchain assets share exposure: ten route through the same Resolv-linked market cluster, and one sits outside it as a control.
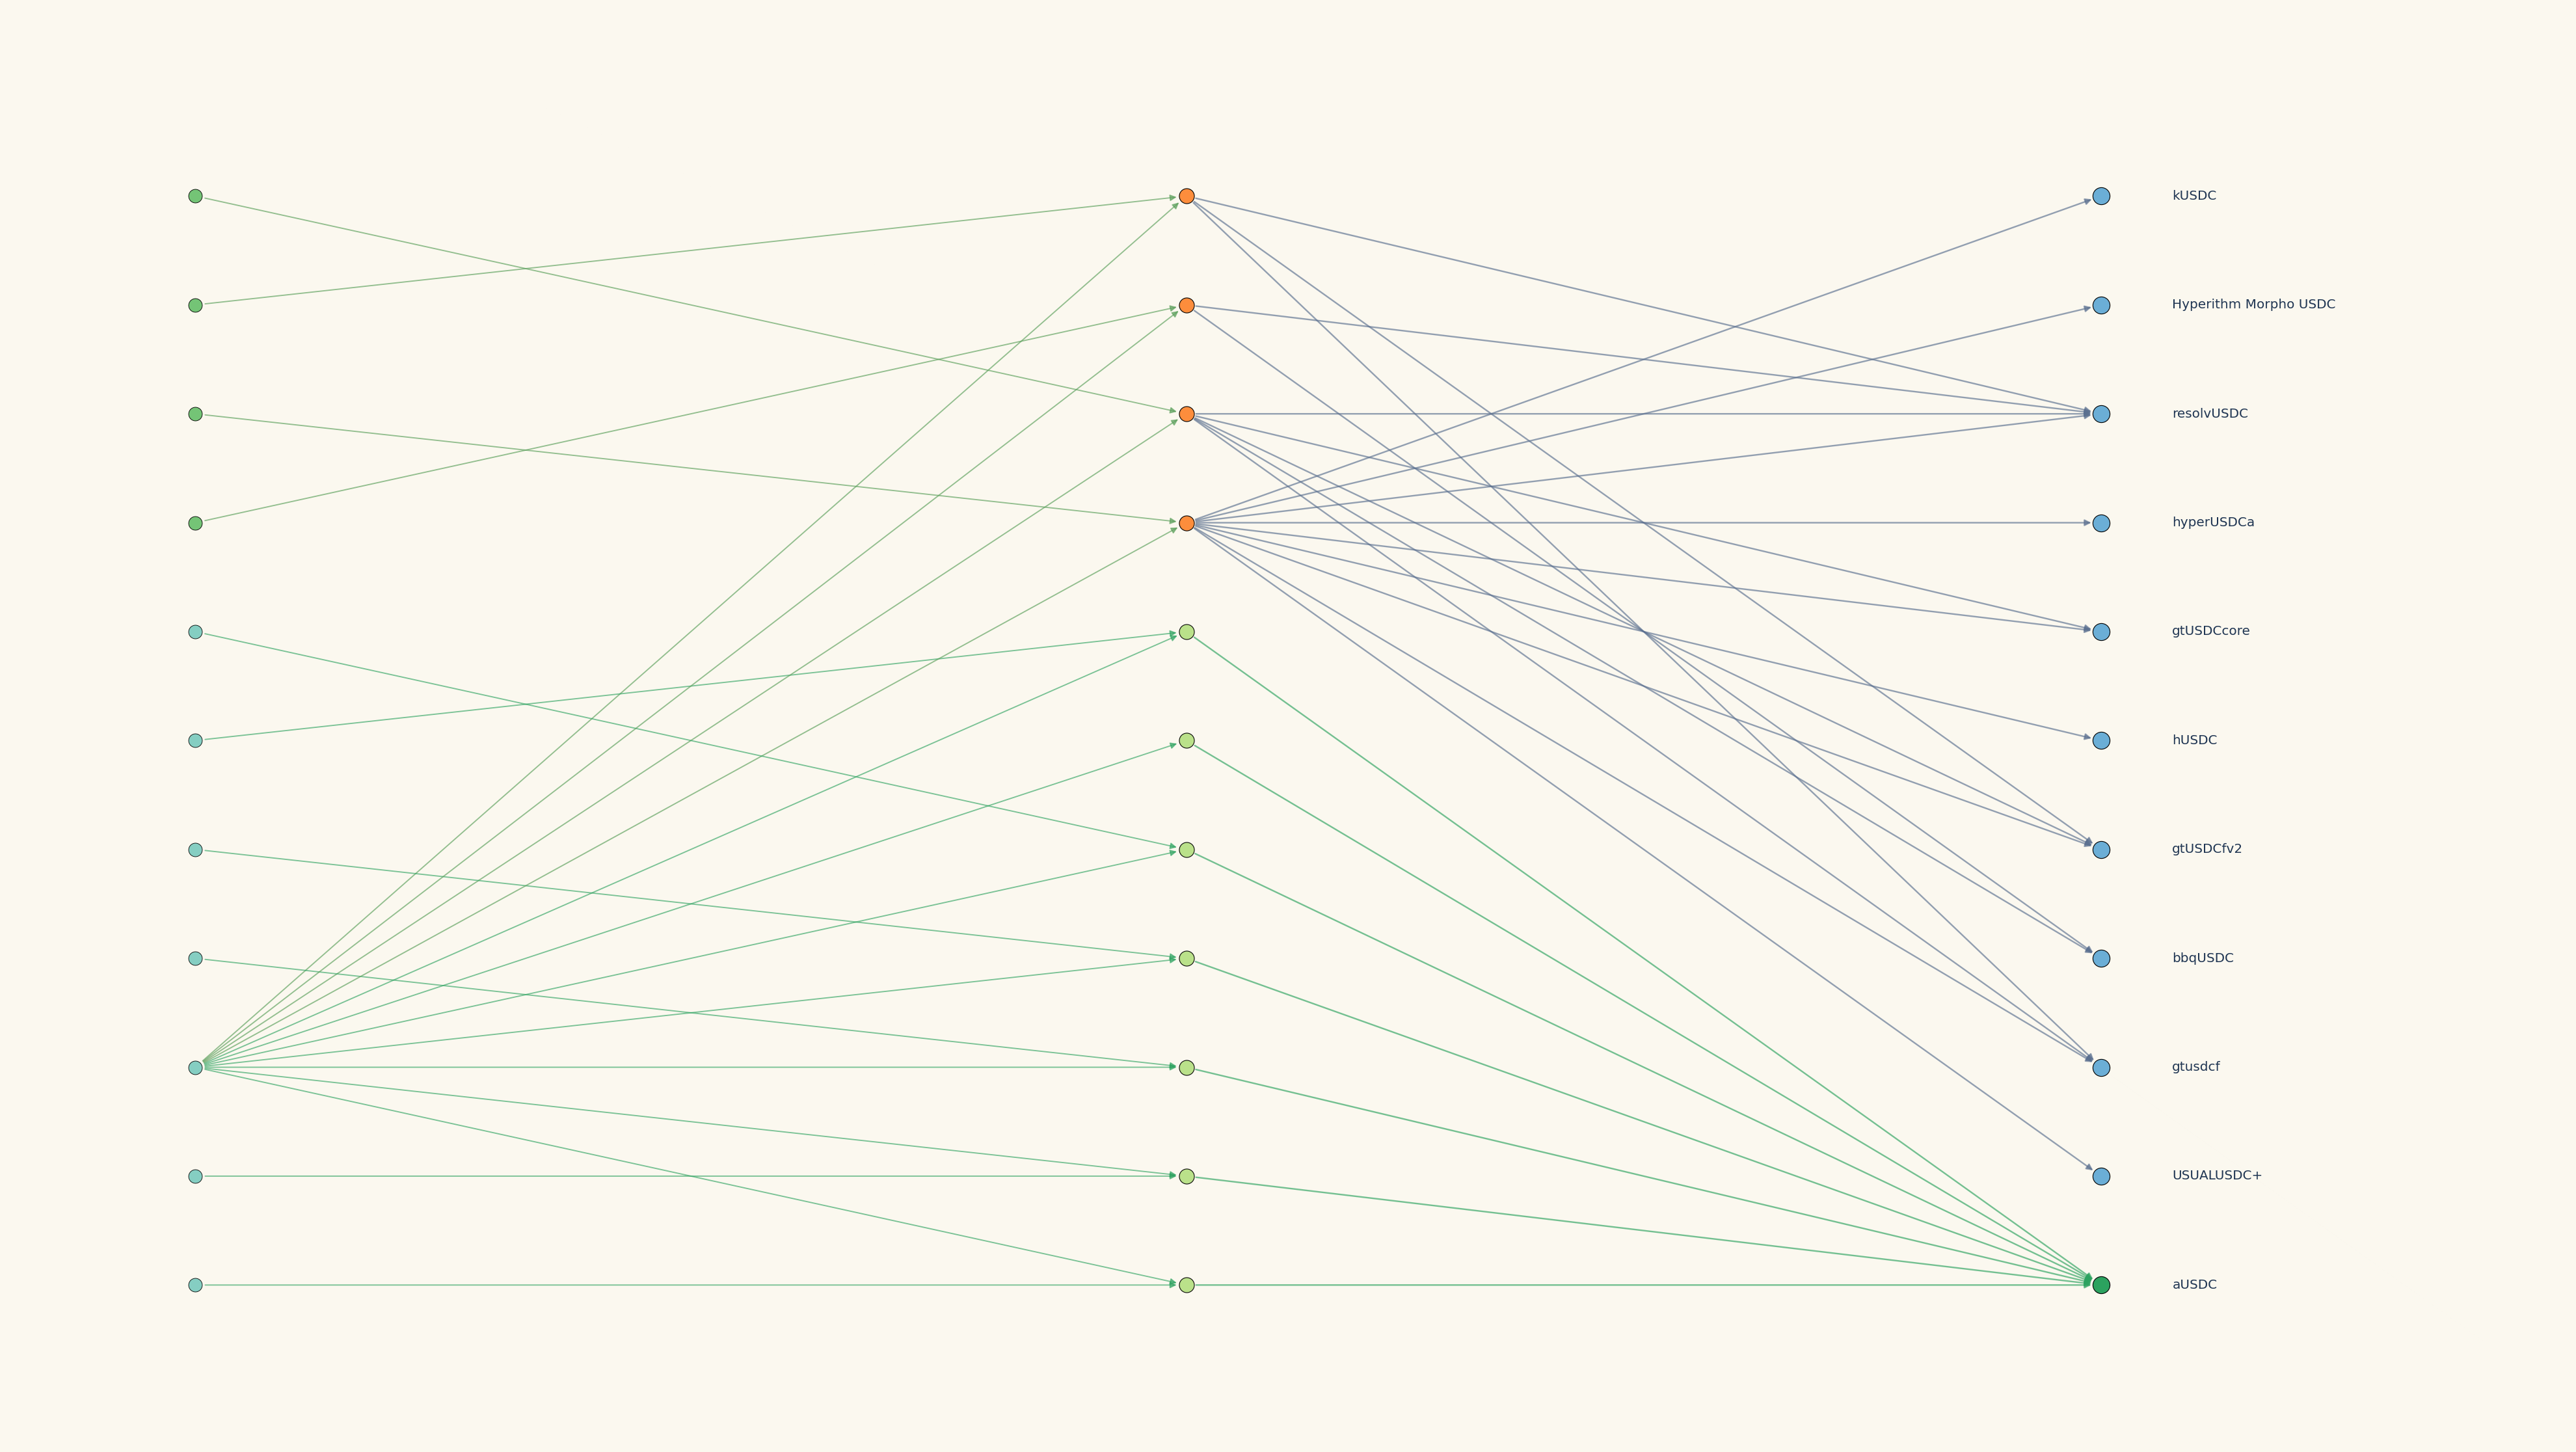
The allocation implication is to move from equal weight across names toward risk budgeting across dependency clusters, using tools such as hierarchical risk parity to group similar exposures before sizing capital. In composable onchain markets, where hubs and shared rails can accumulate quickly, this structural view is close to a baseline requirement rather than an optional refinement. It is one of the more reliable ways to tell a balanced-looking portfolio from a genuinely diversified one before a stress event reveals the difference.
Conclusion
Topology gives an allocator a clearer map of onchain risk: hidden concentration, shared dependencies, and clustering that a simple allocation table does not show.
The practical implication is straightforward: diversification should be measured across true sources of risk, not merely across asset names. An equal-weight book can look balanced on a spreadsheet while remaining structurally concentrated underneath.
At Orion, this kind of dependency mapping is one input into a broader risk framework, built for allocators who need to understand what they own, what those positions depend on, and where exposures overlap, ideally before a stress event forces the question.
References
- Mantegna, R. N. (1998). Hierarchical Structure in Financial Markets.
- López de Prado, M. (2016). Building Diversified Portfolios that Outperform Out-of-Sample. Journal of Portfolio Management. https://doi.org/10.3905/jpm.2016.42.4.059.
- Nicolini, C., Manzi, M., & Delatte, H. (2025). skfolio: Portfolio Optimization in Python.
- Tasche, D. (2005/2006). Measuring Sectoral Diversification in an Asymptotic Multi-factor Framework.
Frequently Asked Questions
- What is onchain topology risk?
- Topology risk describes how failure and value transmission travel through shared infrastructure. A portfolio can hold many assets and still be structurally concentrated if those assets depend on the same small set of markets, collateral rails, or liquidity venues.
- How is topology different from correlation analysis?
- Correlation summarizes co-movement in returns over a chosen window. Topology maps the explicit dependency paths created by composability — who routes through whom, which markets share underlying tokens, where hubs form. Structural overlap can exist even when recent correlations look low, because correlation is a statistical summary and topology is a description of the underlying plumbing.
- What is an adjacency matrix in this context?
- An adjacency matrix encodes connections between nodes such as tokens, markets, and assets. Each cell indicates whether a dependency exists, which allows overlap, shared markets, and clustering to be measured programmatically.
- How should allocators respond to hidden concentration?
- Typically by moving from equal weight across names to risk budgeting across dependency clusters. Tools such as hierarchical risk parity group similar exposures before capital is sized, so the allocation reflects true sources of risk rather than the number of asset names on a sheet.
- Can topology analysis replace fundamental due diligence?
- No. Topology organizes structural dependency; it does not replace issuer, smart-contract, or liquidity analysis. It complements those layers by showing where exposures may already overlap, before a stress event makes the overlap obvious to everyone at once.
- Why is equal weight particularly misleading onchain?
- Because composability creates explicit dependency paths that can accumulate quickly as new markets are built on top of existing ones. Spreading capital across many protocol names does not guarantee spread across independent risk factors if most of those names route through the same underlying rails.
- Does a low correlation between two assets mean they are structurally independent?
- Not necessarily. Correlation is measured over a specific historical window and can look low even when two assets share a dependency that simply has not been stressed yet. Topology is a way of checking for that shared dependency directly, rather than inferring its absence from a correlation figure alone.
- Who is responsible for deciding how much concentration is acceptable?
- The allocator or risk committee accountable for the portfolio. Topology mapping surfaces where concentration exists; it does not set a universal threshold for how much concentration a given mandate can tolerate, since that depends on the mandate's own risk budget.